

← RESOLVE | Research group on Lifestyles, Values and Environment
Overall aims
Households are responsible for over three-quarters of UK carbon emissions when measured from the consumption perspective, and it is now commonly agreed that drastic reductions must be made to combat climate change. A clear understanding of how households use carbon in (attempted) satisfaction of their needs and desires will be a vital basis on which to formulate policies. Accordingly, in this study we asked the following questions. How much carbon is attributable to which kinds of needs and desires? Is the highest amount attributable to subsistence needs such as food and clothing? Or protection (housing and security)? Or our leisure demands? Or to the need to communicate with our family and friends?
Methodology—SELMA
In this study we used the Surrey Environmental Lifestyle MApping (SELMA) framework. This framework estimates UK carbon emissions using the consumption perspective. Using this perspective, upstream carbon emissions that arise in the production and distribution of goods and services are attributed to the households who eventually purchase them. An important aspect of this perspective is that it takes into account all emissions incurred in support of consumption within the UK, whether the emissions occur in the UK or abroad.
Results
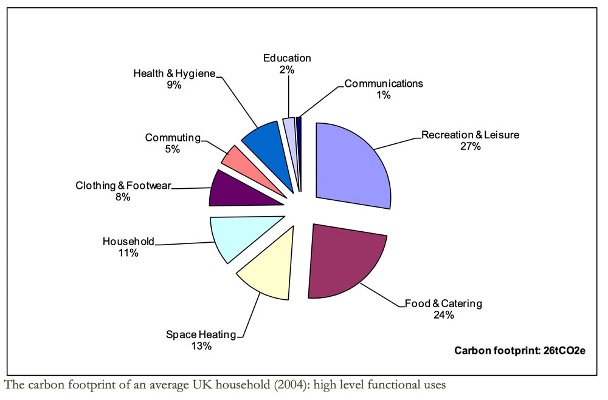
The pie-chart shows the carbon footprint of an average UK household (26tCO2e) disaggregated according to major high level functional use categories. By allocating to functional uses, all emissions that arise due to, for example, eating are allocated to Food and Catering. Hence, Food and Catering includes emissions due gas and electricity used for cooking, and also personal transport fuels used for food shopping trips. In the study we carried out a detailed analysis of the key categories shown in the chart, analysing both the types of emissions (such as embedded, travel, direct energy use) involved as well as the specific activities that gave rise to them. Our results show, for example, that around 10% of the carbon footprint is due to holidays, with total recreation and leisure activities (including holidays) accounting for well over a quarter (27%) of all household emissions. Other notable results are that food and catering accounts for nearly a quarter (24%) of emissions, and that the GHG emissions due to a meal eaten out are around 71-83% higher than for a meal eaten in the home.
Implications
The baseline results in this study indicate which activities give rise to the greatest amount of carbon. This provides a basis for untangling the complex interplay between the material, economic, psychological, sociological and cultural forces that drive the emissions attributable to UK household consumption. The figures presented here provide a foundation for academics, policy-makers and anyone interested in reducing household carbon emissions.
Project Team
Angela Druckman
Tim Jackson
Output
Druckman, A and T Jackson 2010. An exploration into the carbon footprint of UK households. RESOLVE Working Paper Series 02-10. Guildford: University of Surrey.